

What is Microsoft System Center: introducing the types of System Center, getting to know the features and benefits
November 23, 2024
What is Microsoft Project? Familiarity with the history and review of features, revisions, capabilities, application + comparison of Microsoft Project with other project management tools
December 5, 2024
Microsoft Visio is one of the powerful and efficient tools in the field of designing and drawing professional diagrams developed by Microsoft. This software allows users to easily create and edit various types of flow charts, organizational charts, network charts, architectural charts and many other specialized charts using various formats and graphic tools. Due to the wide use of Visio in various fields, including engineering, project management, business analysis and information technology, getting to know this software and how to use it can be useful and necessary for many professionals and enthusiasts. In this article, we will take a closer look at Microsoft Visio, its capabilities and features, as well as how to work with this software so that you can benefit from all the features of this powerful tool.
What is Microsoft Visio?
What is Microsoft Visio?
Microsoft Visio, one of the powerful and useful tools of the Microsoft 365 suite, allows users to easily create various diagrams and flowcharts. This software is widely used to design flowcharts, floor plans (offices), data models, organizational charts, network diagrams and many other specialized diagrams. One of Visio's key advantages over similar tools like Excel and PowerPoint is its underlying structure, which makes diagrams more manageable and professional.
One of the outstanding features of MS Visio is the ability to automatically create a schedule based on various data sources such as Excel files or databases. This feature is especially useful for professional users and organizations, as it allows data synchronization and chart updates automatically.
Microsoft Visio was first introduced in 1992, and nearly 30 years later, it is still one of the leading tools in the field of diagram and flowchart design. In 2000, Microsoft bought this software and since then, Visio has been continuously developed and has become part of the Microsoft 365 suite with new features and improvements. Integrating Visio with other Microsoft tools allows users to easily and seamlessly work with other software in this collection and increase their productivity.
Due to Visio's high capabilities and flexibility, this software has become an essential tool for engineers, project managers, business analysts and other professionals who need to create and manage complex and detailed diagrams. In the continuation of this article, Visio's capabilities and features will be examined in more detail, as well as how to use this software so that you can benefit from all the features of this powerful tool.

Advantages of Microsoft Visio
Advantages of Microsoft Visio
As one of the advanced and efficient tools in the field of designing and creating diagrams and flowcharts, Microsoft Visio has many advantages that make it an ideal choice for professional users and organizations. In the following, some of the most important advantages of this software are mentioned:
- Simple and user-friendly interface:
With a user interface similar to other Microsoft products, such as Word and Excel, Visio makes it easy for users to learn and use. Users can quickly familiarize themselves with its various tools and capabilities and use them. - Diversity in formats and shapes:
This software includes a large number of default templates and shapes that can be used for all types of diagrams and flowcharts. This versatility helps users quickly create professional charts without having to design from scratch. - Integration with Microsoft 365:
Visio is fully integrated with other Microsoft 365 tools. This integration allows users to import data from various sources such as Excel and Active Directory, and share and edit their charts in applications such as Teams and Power BI. - Advanced data visualization capabilities:
Visio allows users to display complex data in a visual and comprehensible manner. This capability is especially useful in project management, business analysis, and engineering, and helps with strategic decision-making. - The possibility of teamwork:
With Visio, users can simultaneously work on a diagram in real time. This collaboration capability increases team productivity and speeds up the process of creating and editing diagrams. - High flexibility:
Visio allows users to customize diagrams to their liking. This flexibility includes changes in colors, shapes, fonts, and styles, allowing users to create charts that meet their needs and organizational standards. - Automation of processes:
One of the outstanding features of Visio is the ability to automate processes using external data. This feature allows users to dynamically update their charts and flowcharts based on changing data. - Support for different types of charts:
Visio can create many types of diagrams, from organizational charts and flowcharts to network diagrams and data models. This diversity has made it a versatile and comprehensive tool.
Visio in Microsoft 365
Visio in Microsoft 365
As part of the Microsoft 365 suite, with multiple integrations and extensive features, Microsoft Visio allows users to generate their own diagrams and flowcharts from external data sources and easily edit them in other applications. These extensive integrations make working with Visio extremely flexible and efficient.
One of the important features of Visio is the ability to link Excel files to create diagrams through the Data Visualiser. This feature allows users to automatically convert data in Excel files into understandable and visual charts. For example, a project manager can import project schedule data from Excel into Visio and quickly create a corresponding Gantt chart.
Besides Excel, another common data source used in Visio is Active Directory. By using this feature, users can visually display the organizational structure of a company. This visual representation can include information such as organizational hierarchy, contact information and job positions, which is very useful for managers and HR teams.
Visio's integration with Microsoft 365 also facilitates team collaboration. For example, in Microsoft Teams, users can simultaneously work on a chart and view and apply changes at the same time. This collaboration feature increases productivity and reduces the time needed to complete projects.
Visio also allows users to visualize created diagrams in Power BI. This integration allows users to display complex data graphically and in the form of interactive dashboards. These dashboards can help make strategic decisions and provide deeper insights from data.
Overall, Microsoft Visio's extensive integrations with other Microsoft 365 tools make this software a powerful and versatile tool that not only enables the creation and management of complex diagrams, but also improves collaboration and data visualization. These capabilities make Visio very useful and indispensable for professional users in various fields, including project management, business analysis, and engineering.
Types of visual diagrams
Types of visual diagrams
Microsoft Visio is a powerful tool for creating and managing all kinds of diagrams and flowcharts, which are used in many fields and different applications. Below are some popular uses of Visio and diagrams that can be created using this software:
✔️ Flowcharts
Flowcharts are a visual tool used to show the sequence of steps, decisions and work flow in a process. These tools use different shapes to represent each step, decision, or event, and arrows to show relationships and flow between steps. Flowcharts help analyze complex processes and allow users to easily understand and optimize processes.

✔️ Organizational charts
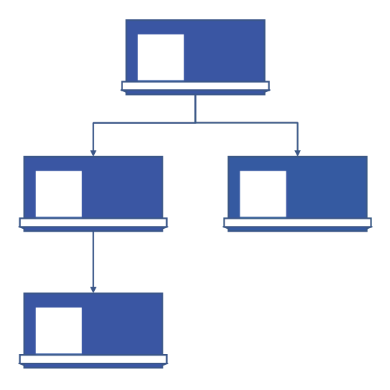
Organizational charts represent relationships and hierarchies in an organization. These charts clearly show which person or unit reports to which person or unit. In addition, these diagrams depict the overall top-down hierarchical structure that helps in planning, managing, and improving organizational performance. These types of diagrams are also known as hierarchy diagrams, structure diagrams and organograms and are used in various industries to display and improve the organizational structure. they become
✔️ floor plans
As scaled maps, floor plans provide detailed information about the footprint of a building or other structure. These drawings are used to ensure accuracy of dimensions, placement of rooms and other details such as furniture and other equipment relative to each other. Floor plans are also known as house plans, maps, architectural plans, building plans, and schematics, and are used in various processes, including planning, designing, and implementing architectural and construction projects. By providing accurate and comprehensive information, these plans help engineers, architects and other members of the project team to continue the design and implementation process in the best possible way and enjoy high efficiency and accuracy.

✔️ Mind Maps
Mind maps are known as more complex and comprehensive diagrams from the point of view of planning and ideation, which group and connect ideas related to general topics, depict the connections between these ideas. These tools are especially useful for brainstorming and analyzing issues more precisely by creating the right atmosphere. Mind maps are recognized as effective conceptual tools that help teams and individuals organize their ideas and concepts and make necessary improvements in their ideation and strategies. By creating a visual and graphic representation of the connections between ideas, these tools help facilitate decision-making processes and the progress of different paths in generating ideas and innovation.

✔️ Charts and Graphs
Graphs and Charts are known as a vital part of Excel, but they are also included in Microsoft Visio in a more complete and customizable way. These tools are used in almost every business presentation because they are remarkably effective at displaying data visually and making it easier for the audience to understand the information being presented. Famous examples of these charts include bar charts, line charts, pie charts, and other types of specialized charts that are used to suit different needs.
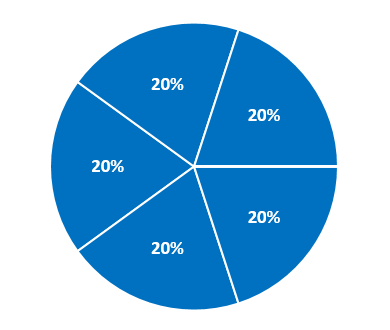
Bar charts are used to show detailed comparisons of values between different categories, while line charts are suitable for showing changes and trends over time or between different categories. Also, pie charts are used to show different compositions and ratios of a whole and are widely used in analytical and reporting applications.
Using these diagrams in Visio allows more flexibility for fine-tuning and designing presentations and reports. Using Visio's advanced tools, users can easily create appropriate graphics to explain complex data and information, helping to make more effective decisions and make the best use of data.
✔️ Gantt chart
The Gantt chart is known as one of the most famous charts in the field of project management and planning. This type of diagram displays the individual tasks in a project, along with the start and end dates of each task, the people responsible for that task, and other important details such as dependencies and relationships between tasks.
The use of Gantt charts helps project managers to improve the scheduling and management of projects and create more accurate planning for the execution of tasks. While Microsoft Project is known as an advanced project planning software, Visio also provides basic Gantt chart templates.
Visio allows users to easily design and customize their own Gantt charts by adding tasks, setting dates, various connections and dependencies, and graphically displaying project entities. This tool allows project managers and teams to see project progress clearly and accurately and manage resources and time in the best way.

✔️ Network diagrams
Network diagrams use symbols and lines to represent the structure, nodes, and connections of a computer network in an environment. These types of diagrams use symbols such as nodes (points) and lines (connections) to show which nodes (for example, computers, servers or other devices) are connected to each other and how information flows in this network.
The main use of network diagrams is to understand and display the topology and physical or logical structure of the network. These diagrams help to identify which nodes belong to which networks and subnets, as well as how they are connected and connected. In addition, network diagrams help IT managers and network engineers to improve network problems, optimize resources, and better manage data flow.
Other uses of network diagrams include network security management, network development planning, and network performance analysis. These tools allow IT teams to improve network efficiency and reliability and identify and fix potential problems more quickly.

Microsoft Visio is known as one of the prominent tools for creating various charts and diagrams that allows users to display their information visually and fluidly using a variety of formats and shapes. This software, which is part of the Microsoft family of products, supports features such as stencils, the ability to create complex diagrams, and export to various formats such as PDF.
By using Microsoft Visio, you can fully respond to the various needs of your organization and present your information in a way that provides the best understanding to stakeholders. Therefore, Visio, as an outstanding and powerful tool for producing specialized charts and diagrams, is always at the forefront of data management and analysis tools.